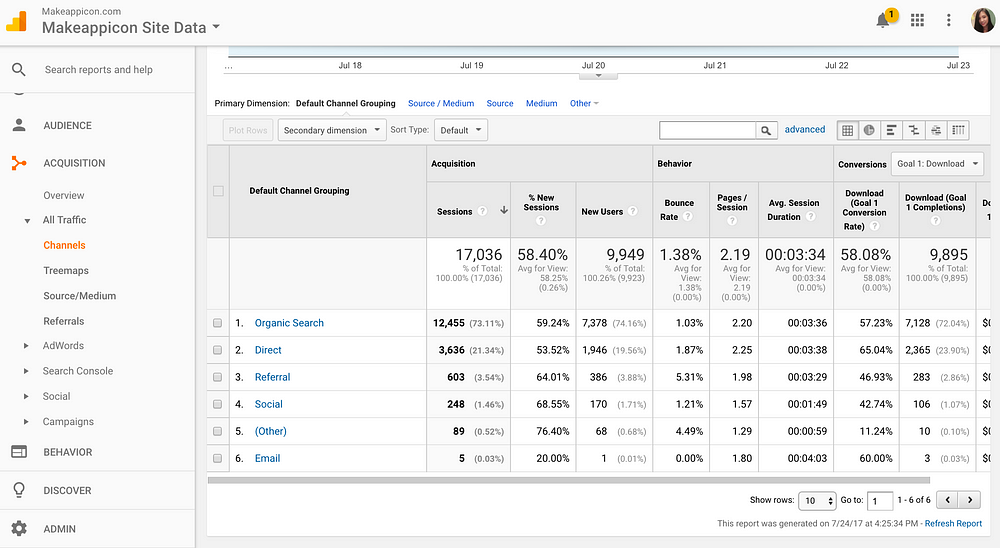
Google Analytics is a great way for business owners to track and analyze where your users are coming from, what they are clicking on around your site, how long they stay on, and where they’re dropping off. With this rich set of data, you can figure out how to increase sales. This article will explore what Google Analytics can do for your business and the basics of how to use this powerful tool.
Before starting, make sure you have Google Analytics set up on each page of your site. This tracker is an object that can collect and store data that is sent to Google Analytics. Below is the code snippet for Google Analytics after you’ve set up a free account:
<br />
&lt;!-- Google Analytics tracking code in JavaScript for web apps --&gt;<br />
&lt;!-- UA-XXXXX-Y is the tracking ID --&gt;<br />
&lt;script&gt;<br />
(function(i,s,o,g,r,a,m){i['GoogleAnalyticsObject']=r;i=i||function(){<br />
(i.q=i.q||[]).push(arguments)},i.l=1*new Date();a=s.createElement(o),<br />
m=s.getElementsByTagName(o)[0];a.async=1;a.src=g;m.parentNode.insertBefore(a,m)<br />
})(window,document,'script','https://www.google-analytics.com/analytics.js','ga');</p>
<p>ga('create', 'UA-XXXXX-Y', 'auto');<br />
ga('send', 'pageview');<br />
&lt;/script&gt;</p>
<p>&lt;!-- End Google Analytics --&gt;<br />
A Basic Intro to AARRR
Before we dive into Google Analytics, let’s talk about AARRR, which stands for Acquisition, Activation, Retention, Referral, Revenue in a customer acquisition funnel. The framework is credited to Dave McClure.
- Acquisition: visitors come to your site from various channels.
- Activation: visitors convert into registered users with their first experience.
- Retention: users come back to your site.
- Revenue: your users pay you money to use your product.
- Referral: users refer your site to their peers.

As you can imagine, there’s a huge drop off between first-time site visitors to regular, active users, and hacking this “Growth Funnel” is what gave rise to the “Growth Hacker” position.
In this post, we will be focusing on the first three parts: AAR, which translates to the question: how do you get first-time visitors to love your site and come back?
Acquisition — where did all these people come from?

Traffic basically reflects the amount of people visiting your website.
Importance:
Acquisition shows where your users are coming from. Knowing the source of referral traffic helps you optimize your marketing strategy. Should you be focusing on Facebook, Twitter, Reddit, or other platforms? But before you jump to optimizing your highest referral traffic channel, you can use Google Analytics to figure out if that source is bringing you quality, relevant, traffic. Below are some of the key metrics that will tell you about your acquisition channels.
Metrics you should be focusing on in Google Analytics:
- Acquisition > Channels: What’s your split between social, direct, referral, or other types of in-bound traffic?
- Audience > Overview > Bounce Rate: Number of people who leave your site after the 1st page, which indicates quality of in-bound traffic — you want to reduce this number.
- Audience > Technology > Mobile (Overview): Most people now browse information mobile-first. You will want to make sure your site content is optimized for both mobile and desktop browsing (i.e. responsive); knowing how your users first access your site will also tell you where to focus your updates first.
- Audience > Technology > Browser & OS: Optional, but browsers will display information differently. For example, if most of your users are using Firefox, which doesn’t support a specific font you’ve been using, will that severely affect your design and user experience?
- . Behavior > Site Content > Landing Pages: Knowing which pages are attracting people will tell you what evergreen content has a long-tail value (e.g. lots of people discover you by searching about AR) and whether campaigns or link distribution efforts have achieved their desired effects.

What to look out for:
What are your top referring channels? Are people finding your site through SEO searches and keywords? Or are they finding you through social media channels like Facebook or Instagram? Knowing where your audience comes from helps you target low-hanging fruit for marketing strategies to increase traffic; if you have an active social media following that is clicking into your site, try to optimize your social media content by trying video or posting more regularly.
However, you also need to consider whether your highest sources of traffic are also quality sources for traffic. For example, if you are a B2B SaaS, do you really need Facebook fans clicking through to your site through funny memes? Would direct referrals through major industry publications bring more relevant potential users? If you want to have more new users discover your site organically, you will need to do more SEO and create content with relevant keywords to help rank higher in search results. The indicator that you have found good acquisition channels is your bounce rate, which indicates the % of people who leave after landing on your page (i.e. your content isn’t relevant to them). That said, it’s normal to have a high bounce rate if you have a single-page site. In other cases, a low bounce rate indicates high-quality traffic, so see if you can get it from 90% down to 50% and that will make your user Activation much smoother.
Activation — SIGN UP!

Importance:
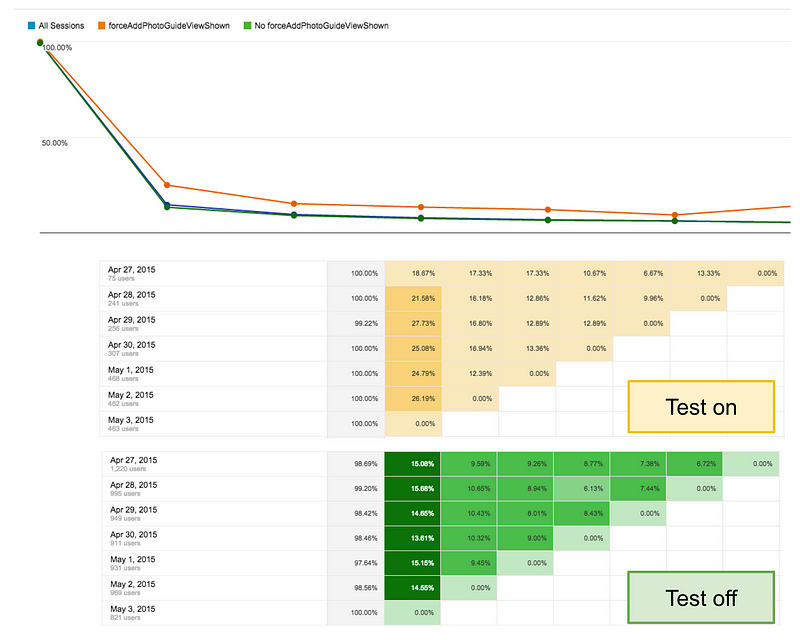
Activation is when visitors of your site convert to actual users or subscribers, even if they’re not paying yet. You want relevant visitors to either sign up for your mailing list (for future e-mail marketing) or to go straight to trying out your product (especially if you have a freemium model). Once you have eyeballs on your site, you should gather as much information as possible about their behavior to guess at their considerations, concerns, and decision making processes in order to provide value so that they will pay. This is where A/B testing comes in. Try to change a photo, edit your copywriting, or shorten your sign-up form depending on where users drop off.
Metrics you should be focusing on in Google Analytics:
- Audience > Overview > Pages / Session: what’s the average number of pages your visitors view during a session? Do you have heavy users?
- Audience > Audience > Benchmarking > Channels > Compare metrics: Bounce Rate vs. Benchmark Bounce Rate: What’s your site bounce rate (if you have a multi-page website) and how well you’re doing compared to your peers.
- Audience > Behavior > Engagement: How long are your users engaging with your site? 10 seconds? 1 minute? This gives an indicator of content relevance.
- Audience > Users Flow: Tells you user behavior and user logic as they click from one page to another on your site. This helps you identify broken pages and pages you want to optimize.
Behavior > Site Content > Exit pages:** Where are your users losing interest / experiencing road blocks to sign up? - Conversions > Goals: Click Through Rate (CTR) — The ratio of people who click through your site to sign up vs the visitors who just land on your page.
Note: You must set this up in your site to properly track goal conversions on Google Analytics. This is not automatically set up.
What to look out for:
Are your users staying? What are their sessions like? — This tells you the active engagement of the user on your site. How many pages they browse per session tells you how much of your information they’re interested in, and how long they stay tells you how relevant your information is to your visitors. An active session equals the timeframe a user interacts with your site. You can set your session time to any length you want depending on your product (such as if it is a service requiring them to make decisions, then maybe 30 minutes is a good ballpark). In order to get more accurate data, it is recommended to set your session timeout to the average length of time on your site. This way you can more accurately gauge how users are engaging with your content. Note that no matter how many times a visitor visit your site during a session (say 30 minutes), it is still counted as one single session.
What was the behaviour and user flow like through your site? Assuming that you’ve optimized your bounce rate for the Acquisition phase, the next thing to focus on is a high CTR, which reflects activated users. If your CTR is still low, where are your users dropping off? For example, you can find out if users are all exiting at a specific page and focus on fixing that page to improve your sign-up.
After you find out how users are behaving on your site, you can make data-driven decisions on how to make changes. For example, you may want to start A/B testing pop-up offers to encourage sign-ups because your users are more price sensitive.
Retention — Thank you, please come again!

Importance:
So you’ve got people registering on your site— that’s great! But how do you get them to keep coming back? Whether you offer many products for repeat buyers, or just a one-time service, you can always work to improve to either get repeaters or more customers. If you can get your converted users to come back, they are more likely to refer you as well to new users!
Metrics:
- Audience > Behavior > New vs Returning: Indicates whether you are getting more exposure and also whether people find your content valuable enough to come back
- Audience > Active users: Number of unique users who visited your site in the past 1 / 7 / 14 / 30 days.
- Audience > Lifetime Value: The value of users based on their lifetime performance (currently 90 days) on your site (more advanced)

What to look out for:
Do you have a steady number of old users returning to your site? Even as you are increasing new users (because you’re continually optimizing your acquisition channels), you want to improve your retention, which is reflected in steadily increasing return visits from old users.
Old users engaging with the site and having high page views indicates that your product is valuable. Whether it’s recurring purchases or a lot of one-time purchases that make up your revenue, you can continue to offer value to your customers. For example, people who have used your medical referral platform as a one-off for themselves may still be interested in your site because they find your blog pieces useful and share them with their family members who have chronic conditions. In fact, maybe your retention strategy will be so successful you can create another revenue stream, such as subscription for your content.
Google Analytics is just the beginning.
There are many other tools to measure the key metrics in the AARRR funnel, but Google Analytics is one of the most comprehensive tools that just requires a code snippet to integrate. Once you have access to the data, you can move forward with systematic tests for better understanding your users and ultimately getting them to use your product.
If you found this piece helpful, click the 💚 below so others can see too!
At Oursky we’re all about helping brands and entrepreneurs make their ideas happen. Get in touch if you’re looking for a partner to help build your next digital product 😻


2 comments
This is a great primer, I am surprised no one has thanked you. Thank you very much for explaining AARRR framework and how to use GA to increase revenue.
Amazing! Its actually amazing post, I have got much clear idea on the topic
of from this article.